Sunday, July 31, 2011

7/21 - 7/28

Done last week:
  • Improved progress bar; I think it's as good as it needs to be for now.  The black-boxing issue mentioned two weeks ago remains unsolved but different indicators for different processes are now working.
  • Finished input verification
  • Added cancel feature
  • Added save feature
  • Implemented memory overflow protection
  • Improved algorithms a little
  • Started working on an automated option that analyzes several network files at once and compiles a chart of the results
To do:
  • Finish automated option
  • Get a working copy to Jeffrey, the linguist
  • Try out another algorithm optimization I found
  • Work on the content for a website about networks & fractals
Progress is a little slow this week due to sickness + computer troubles, either of which problems alone would be easily surmountable but which together are a bit much.

Thursday, July 21, 2011

7/13 - 7/21

This week I uploaded the new version of the African Fractal applet to the website, and made some edits to the html to make it all run smoothly.

For the network applet, I got a pretty good linearity measure working with the help of Jed.
I also implemented the generation of predefined types of graphs; now I want to add a save feature so users can reuse these graphs.
I added some input verification and made a tiny bit of progress fixing up the progress bar, but both these things need more work.
I've contacted a linguist interested in analyzing networks based on sentence construction, which I'm really excited about!

Besides the unfinished things just mentioned, I also want to work this week on:
experimenting with the algorithms
adding a cancel feature

Wednesday, July 13, 2011

7/6 - 7/13


Tasks accomplished this week:
  • Multiple networks can be loaded in one applet, to make comparisons easy.  Also, many dimension-calculations can be run on each network without losing old results.
  • Threading is fixed, so gui always remains responsive
  • Interface in general is (hopefully) cleaner and more intuitive -though it's also more complicated with added functionality
  • There's a progress bar to show progress of dimension calculation, which can take a while for larger networks.
  • File uploading is exponentially faster (I discovered that using + concatenation to build a big string from a file is a bad idea - as the result string gets bigger and bigger it takes longer and longer to add the next piece.  Using a StringBuilder and .append() is much better.  Now files that used to take me almost a minute to read into a string are done in a blink.)
 Some screenshots:
What it looks like on startup.
The information about the network (n, k, D) is now contained in the tab for that network.  The loading panel is always accessible for loading more, and old networks stay "alive" (you can keep running analyses on them if you like).
 
Analysis in progress.
Panels with results from dimension calculation display the input used to create them as well as the computed dimension and r, an indication of the deviation of the data from a straight line (and hence sort of the reliability of the dimension value, though it's not really the best way to measure that).  The "use D" button averages this value of D with any other computations of it that the user chose to "use" and displays that up above, where it now says "D: uncalculated".  This way a user can experiment with different inputs and keep only the results from combinations that turn out to be helpful.
Things to work on:
  • Figure out a better way (besides "r") to measure how well a line fits the data (working with Jed on this tomorrow)
  • Add options in the loading panel to generate graphs of predefined types - random, trees, lattices, etc. - so users can compare the analysis of their networks with that of other models with the same n and k (number of nodes and average degree)
  • Experiment with algorithm speed improvement - look into optimizations and approximations
  • Make it sounder - make sure users can't overflow the memory and take care of bad input
  • Let the user cancel computations
  • Improve the progress indicator - parts of the computation are so black-boxed it's hard to accurately tell the progress without compromising encapsulation.  Also if a user runs two different long computations at once they can only see the progress of the most recent one.
  • Keep looking into applications

Wednesday, July 6, 2011

6/26 - 7/6


Tasks accomplished:
  • Applet can now read and write graphs in XGMML.
  • GUI is more interactive - loading graphs and analyzing for dimension can now be done dynamically
  • I got data for the metabolic network of E. coli and the protein interaction network (PIN) for yeast  from http://www-levich.engr.ccny.cuny.edu/~hmakse/soft_data.html and analyzed them, getting very close to the same results as others (3.4 for E. coli and 1.9 for the yeast).  My results for E. coli are often a little high, but perhaps I'm not using the identical data (it seems there are several versions of these data - everywhere I look gives a slightly different number of nodes).
  • Minor improvements to the data displays
Some screenshots of results:

E. coli.  The horizontal axis (ignore all coordinate labels for now; this was before I fixed them) represents box-size (maximum path length between any two nodes in a "box", or sub-net), and the vertical axis is the number of boxes needed to cover the network.  For a fractal network the graph when scaled logarithmically (like here) should approximate a straight line.  Notice the "D: 3.40..."  Never before have I been so excited to see that number.

Same chart for the PIN of yeast.  D = 1.91 - yay!

Yeast again; this time the vertical axis represents calculated dimension at each stage of the algorithm.  As mentioned in my previous post, the values should end up very close to a single value for a fractal network, and here they do.

Things to focus on now:
  • Further improve gui - draw networks themselves, make the charts more readable and customizable
  • Look into more applications - find interesting networks to test (if anybody has any ideas, let me know!)

Monday, June 27, 2011

6/12 - 6/26


 These last two weeks I've been working on the applet to analyze fractal dimension on networks.

What I've done so far:
  • Figured out the mathematics of calculating fractal network dimension
  • Implemented algorithms for the calculation
  • Realized my understanding of the math was wrong and started over
  • Repeated the above actions several times
  • Made some simple graphics to display various information about the network and the algorithm results
  • Tested some graphs to see what would come out
 The fractal dimension of a network has to do with how fast the number of nodes within a distance from an arbitrary node grows with the distance.  So for a network represented by a straight line of vertex-edge-vertex-etc., I would expect to get a dimension of 1.  The program gives ~.93, so I'm guessing there's some experimental error happening.
I also tested a graph that looks like the Sierpinski triangle, with vertices for line intersections and edges for line segments.  When the graph is constructed to match the triangle at 7 levels of recursion, I get  ~1.51 for the dimension.  The dimension of the actual Sierpinski triangle is  ~1.5849  - I don't know if I should be getting that for the network or not.  But here's a cool thing:  this is the plot of estimated fractal dimension at different points during the algorithm's execution


It isn't all on a straight line, but the important thing is that it isn't trending anywhere.  I'm not sure if this is sufficient to show a network is fractal, but it is necessary.  Compare to the plot for a random (therefore non-fractal) graph with the same number of vertices and edges
Definitely going somewhere.

I also put together a small synonym graph and analyzed it - the plot isn't as steady as for the triangle but it's much better than for a random graph of the same size.

Next steps:
  • Test networks with known dimension
  • Make it read and write graphs in XGMML
  • Improve graphics - readable coordinates, optional logarithmic scaling
  • Make gui more interactive (right now graph loading is still hard-coded)

Monday, June 13, 2011

Work 6/5 - 6/12

This week I continued working on puzzling out the dimension-calculation.  I realized that whenever there is a permanent, inactive line in the pattern, the dimension has to be at least 1 because that line is 1-dimensional.  But the question is, when these inactive lines get replicated ad infinitum,  when does the dimension of the set of them grow to be >1?  The approach we're looking at right now is to assume it is no greater than 1 when the dimension of the active part (given by the solution to the Moran equation) is <1, and no greater than the dimension of the active part otherwise; this lets me put in a simple guard making sure that whenever there are inactive segments the dimension is at least one.  It's a little counter-intuitive because of situations like this:  
One would think the dimension of this shape would be something >1, but since the Moran equation yields 0.97 which is <1, my algorithm in its current form settles for just plain 1.
The FractaSketch program that was the original inspiration for this applet does this as well.
___

I fixed a bug with the grid resizing feature; the version on the site would make the current shape invisible after resizing, and the code I was working with disabled grid-resizing altogether after starting to build a shape.  Now users can change the grid size at any time without losing their work.
___

I also made a change in how the different orientations get treated through replication steps.  It's hard to explain concisely but for an example:  before, a yellow (y-axis reflection) segment reproduced by any other segment would be a yellow segment still, but now it gets composed with the segment reproducing it so when a purple (x-axis reflection) reproduces a yellow, it turns it into a blue (pi-rotation), and when a blue reproduces a yellow it turns it into a purple and so on.  For illustration, take this seed and its second iteration (which looks the same in both versions):

Before, the third iteration looked like this:

After, the third iteration looks like this:

and after a while it looks like this:
which is irrelevant but pretty neat.  I don't think either is more theoretically sound than the other, but the new way is how I would expect the program to behave (it's also how the FractaSketch program behaves).

Also this week I've started a new project - an applet to measure fractal dimension on networks.

Sunday, June 5, 2011

Work progress 5/29 - 6/5


First up this week, I think I figured out what was causing the incompatibilty problem where seed shape files saved by one version were unloadable by the other.  It's an issue with serialization - some changes must have been made to the SeedShape and Segment classes between the two versions, so the saved (serialized) instances are not recognized as the same class.  Since I'll be introducing a version 3, I might make a translating program to read all the old saved shapes, create instances of the newest version, and re-serialize them.
___

The next thing I did was notice and fix a problem with two of the types of replacement lines.  Both yellow and blue lines replicate the shape reflected across an axis perpendicular to the baseline.  In order to do that, the code reversed the order of the points in the shape from left to right; however, the segments were still iterated through in the old order, so the segment information was not lining up with the correct endpoint information.
___

The most interesting task this week was to recreate the fractal dimension calculating part of the program (since we didn't have the source code for that part).  Dr. Krishnamoorthy gave me the C code originally used by my predecessor as a basis - it approximates solutions to polynomial equations, such as Moran equations (equations relating the dimension of a self-similar fractal with the various ratios of scaling used in replication).  So all I had to do was translate this to java and add a bit to construct the Moran equation of a given fractal, and voila, I can compute the dimension of Sierpinski's triangle to be 1.58496 +- .00001.  That's even better than wikipedia.  I still need to do some work making it display prettily and figuring out when to calculate it for maximum efficiency.

Also, there are some problems with this approach (though I think it's good enough for its purpose).
First, the algorithm doesn't take into account how much the lines of the shape overlap each other.  For instance, if the shape is made up of several replicating lines positioned so that it looks like one straight line (and continues to look so in all iterations), one would think the dimension should be 1.  But the algorithm treats it the same as if all the lines were skew and non-intersecting, in which case the dimension is usually > 1.  The algorithm gives this dimension to both cases.  However, since nobody's really interested in making replicating shapes that look like line segments for eternity, I don't think this is a real problem.  (If even part of a seed shape overlaps itself, or if subsequent iterations layer lines over each other exactly, the same problem occurs to a less noticable extent, but again, I don't think it happens often enough to be a problem and it is nearly always avoidable.)

More worrisome is what happens when there is only one replicating segment:  if there is no other information in the shape and the segment's scaling ratio is <1, the algorithm gives a dimension of 0 which as far as I've been able to read seems to be ok; however, if there is other information (inactive, non-replicating segments that will get replicated by the one active segment), the dimension certainly shouldn't drop to 0, but since the algorithm ignores inactive information it still does.  An example of this is a logarithmic spiral:


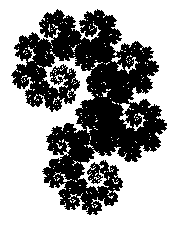
The applet version currently on the site gives it a dimension of 2, my code gives it a dimension of 0, and I've read it should really have a dimension of 1, though I don't know the reasoning behind that.  A more intuitive example is this one:

It's pretty obvious this should be 1-dimensional, but again the old version gives 2 and my version gives 0.
Also, the Moran equation is only valid when all of the scaling ratios are < 1; if a fractal spreads without limit this method is not applicable.
___

Another priority for this week was to fix an inconvenience with entering a value for line thickness:  one used to hit "enter" after typing in the value to make it update, which was mightily convenient but entirely unintuitive.  We settled on making it auto-update with every keystroke in the textfield as the best solution, and I think it works beautifully.
___

One more thing I did was fix an annoyance where the edit-panel would lose the keyboard focus after certain buttons (like "Clear") were clicked and therefore wouldn't be able to receive keyboard input again till a double-click point-creating action was made; this made deleting points at certain times impossible.  Now the panel requests the focus again every time the mouse moves over it.
___